

The startup had already racked up great wins. They had signed up multiple B2B customers. User feedback was positive. Traction was excellent. The metrics were improving. The team was rock solid. Yet investors weren’t biting. What were they missing?
The founders mentioned that potential investors were asking for a one-page dashboard along with the pitch deck.
A glance at the dashboard showed exactly what was wrong: leading the page were summary forecasts of the heavy hitters: revenue, cash flow and expenses.
Had showing investors what they were looking for backfired on the founders?
What Investors Really Care About
Investors do care about fast growth and attractive scale. But showing income statement numbers isn’t the best, or even the right way to tell your growth story.
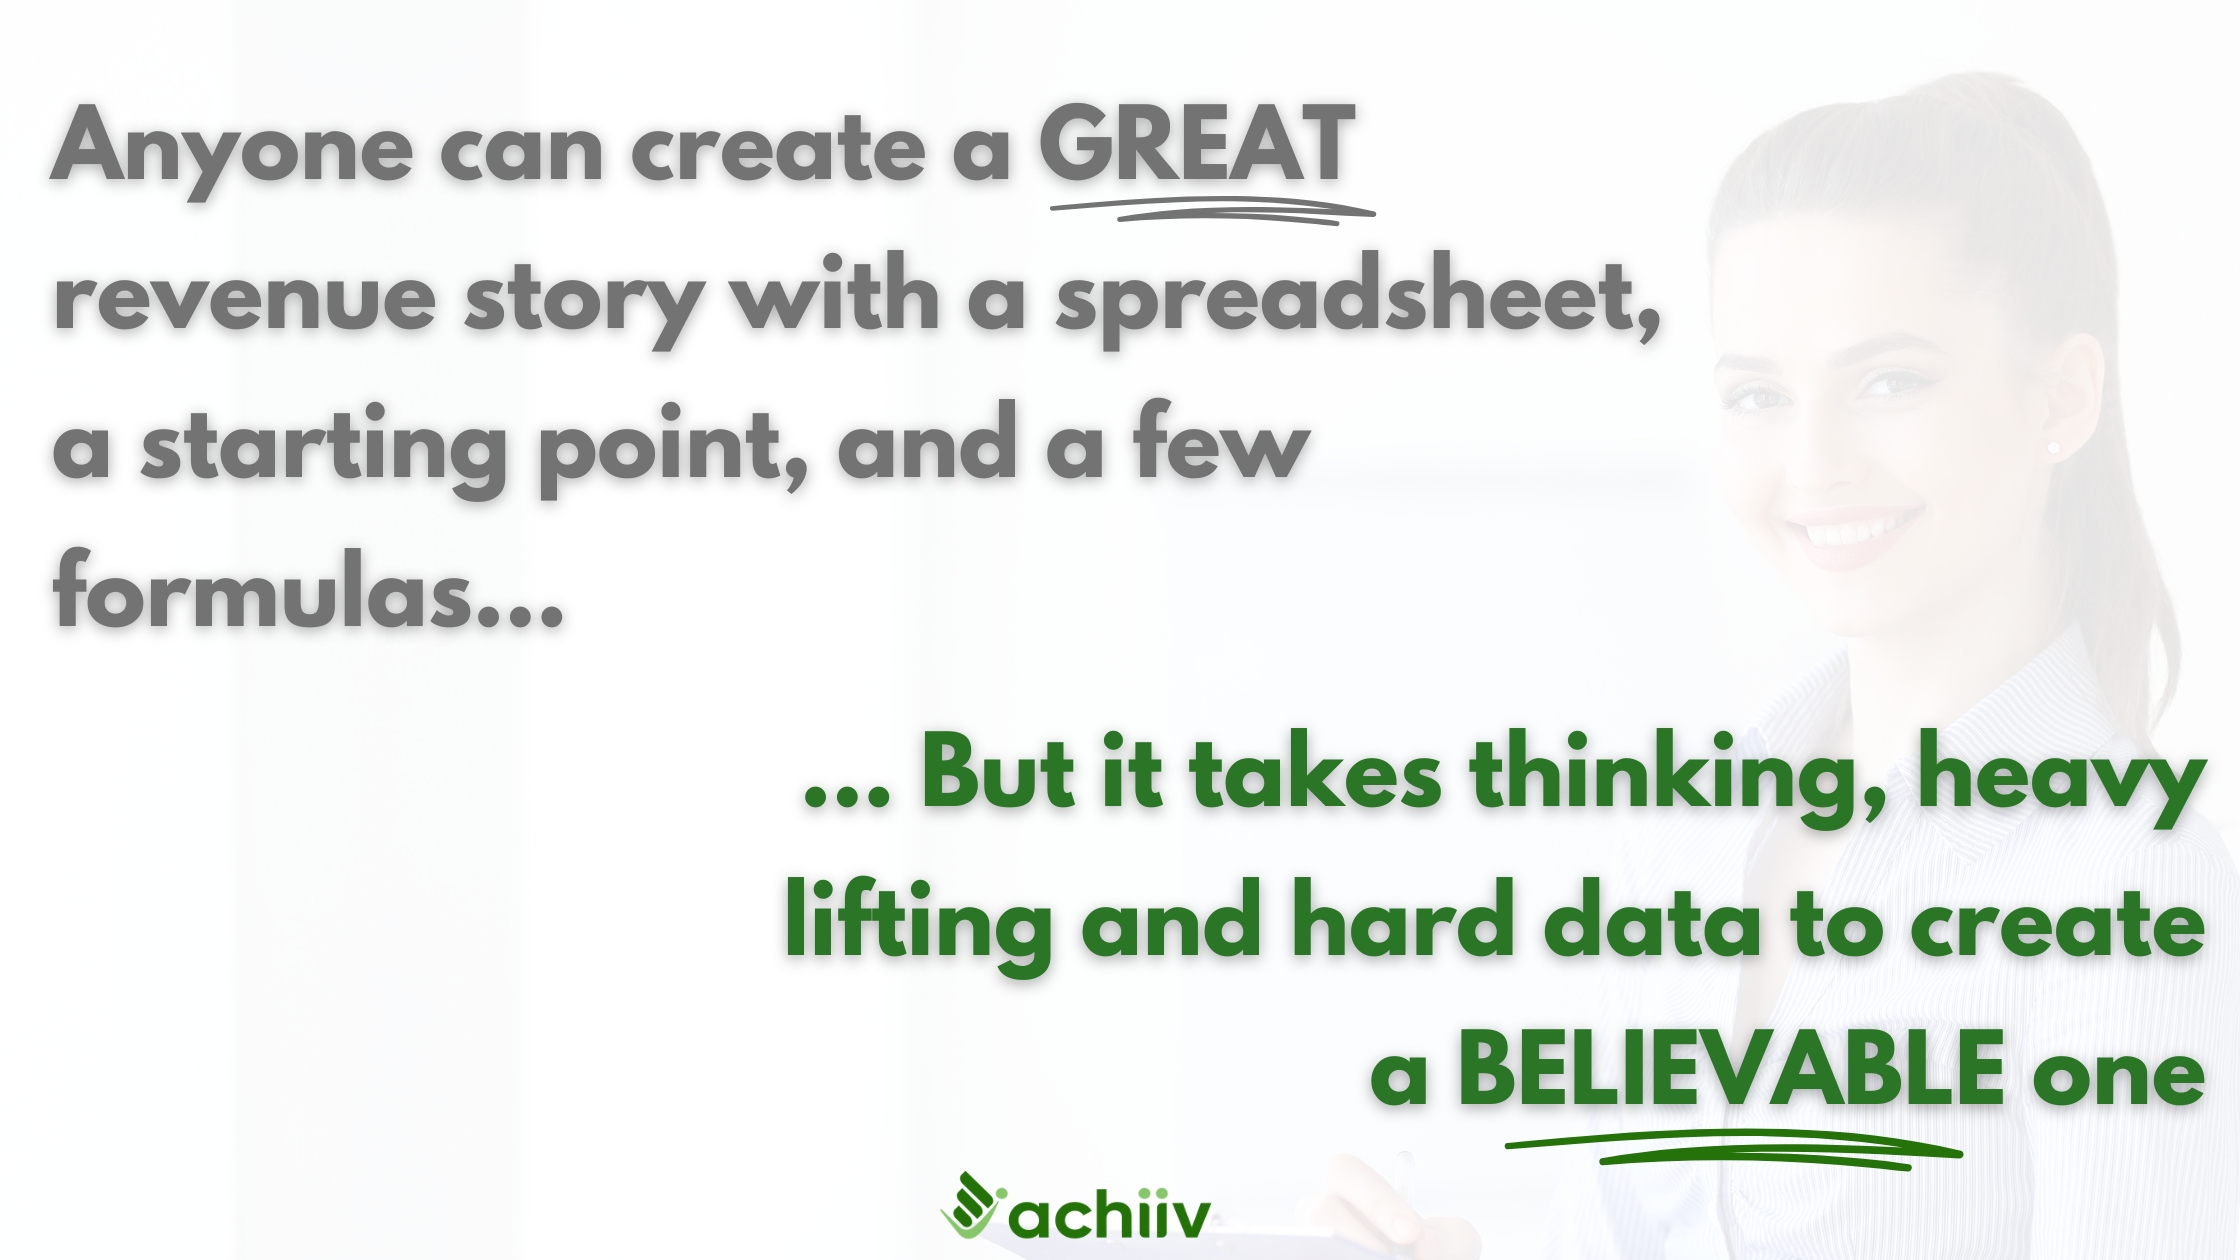
Anyone can create a great revenue story with a spreadsheet, a starting point, and some formulas. But a great revenue story isn’t necessarily a believable one.
The credibility factor is in the how: what drivers will lead to sales, how reliably the relationship works and why the dots all add up.
What investors were looking for in that dashboard were these clues: clues that would demonstrate with real data that the founders had cracked the revenue code, and were well on their way to executing on sales, frugally and profitably.
These clues are rarely, if ever, found in the financial statements. For example:
- What specific customer segments did they choose, and why?
- What channels were they investing in, and how well were they deploying into those channels?
- What did the customer purchase journey look like, and how were they managing it?
- What were the key operating levers, and how was the team honing those?
- What would tell the founders that sales were at risk, and how were founders monitoring those signs?
Proving this story is an order of magnitude more important, and challenging, than showing rosy financial projections. From an investor’s point of view, it takes a long time for results to show up on financial statements – too long anyway for founders to fix what’s going wrong and accelerate what’s going right.
Invert The Pyramid
To tell the right story, the founders had to flip the dashboard on its head so it followed the same sequence as their actions and results:
- Lead with revenue metrics
- Show critical operating metrics
- Close with financial stewardship and profitability metrics
The redesigned one-page dashboard needed far less explanation: it was easier to understand and much more persuasive to a potential investor.
Part 1: The Revenue Story
No revenue means no business. Revenue engine effectiveness is always the first stop for both founders and investors. So the right approach was to zoom in on metrics showing:
- Great lead generation performance across the top channels
- A healthy fast-moving sales pipeline that foreshadowed solid future contracts
- Metrics on prospects’ decision journey that provided early warning on sales at risk
- Excellent monthly sales velocity that showed the engine running smoothly
Part 2: The Operating Performance Story
With the data to prove their chops in generating sales, step two was to demonstrate great execution.
The key questions were:
- What were the critical deliverables on every contract?
- How did the life of a single contract play out within the business?
- What dials/numbers did they need on their control panel to tell them if things were going well or badly?
Their business was a composite of hardware, software and human-assisted support, with installations at multiple customer locations.
To simplify their operating performance story, they highlighted:
- Number of customer locations covered
- Reportable incidents uncovered by the machine learning algorithm
- Increasing efficiency of human-assisted support, with improving quality
This small set of metrics painted a compelling picture of how they were rapidly expanding their customer footprint, while improving both software effectiveness and staff efficiency.
Part 3: The Cash, Growth and Profit Story
The last and critical pillar to the story was great financial stewardship. The founders had to demonstrate that they managed cash well, were vigilant about expenses and focused on getting to profitability quickly.
For this section, the founders focused on three main areas:
- Cash – monthly burn, expected cash balance and revenue inflows
- Growth – Monthly recurring revenue, growth rate, average revenue per installed location
- Efficiencies – SG&A expense, forecasted margin
These few metrics were more than enough to make their case.
A single page of hand-picked numbers intelligently structured and thoughtfully spaced (e.g., quarterly for the next 8 quarters) had lifted their story into a compelling tale of sharp focus, effective sales and disciplined execution.
An added bonus: better oversight over their business, whether fundraising or not.
Improved traction from investors was a sweet validation that they were now on the right track with their startup.

Writing Your Startup’s Short Story
Whether or not you’re raising, there’s power in designing a one-page dashboard that shows you exactly how you’re managing your startup’s limited resources to maximize progress and impact, especially in driving repeatable, high-quality revenue.
You can start where you are, with what you have, and build as you go:
Step 1: Follow The Money
Identify the critical levers in your business that lead to revenue. Focus on metrics that highlight the most important/ risky aspects of your specific revenue engine. For example, consider:
- Segment selection: Qualified leads by market segment
- Channel strategy: Leads by channel (e.g., utility partnerships, paid digital for cleantech startup), cost per lead, conversion rate by channel
- Lead nurturing and conversion: Contracts in negotiation, expected contract value by segment, close ratio
- Sales velocity: Average sales dollars closed per month
If you’re pre-revenue, focus on drivers that are prerequisites to revenue. For example:
- Biotech and life sciences: Number of clinical trials initiated, patient enrollment rate, FDA approval timeline and stages completed
- B2B / enterprise: Number of paid pilot programs, LOIs obtained
- Cleantech / energy : Levelized cost of energy (LCOE) compared to traditional energy sources, partnerships with utilities, government grants and subsidies.
Step 2: Prove You Can Execute
To prove execution, pinpoint the critical areas your startup has to get right to flourish. For example:
- Life sciences and biotech: Manufacturing yield (e.g., percent of usable products per batch), patent portfolio strength
- Renewable energy: Installation efficiency (e.g., installation time per project, cost per kilowatt installed), system performance (e.g., production per panel, uptime percentage)
- Fintech: Transaction volume and value, risk levels ( e.g. fraud rate, default rate)
- Edtech: Student engagement (e.g. completion rate), outcomes (e.g. skill acquisition rates), technology performance (e.g. uptime, usage load)
Step 3: Get the Critical Financials Straight
Only then should you spotlight your financial stewardship record:
- How good is your cash position? How well are you managing it?
- How tight is your expense discipline?
- How well are you monitoring and managing profitability and growth?
If you don’t yet have real data on your metrics, start with pilot data (with appropriate context), industry benchmarks and/or targets your business is aiming for, and track to actuals. Even with limited data, this exercise will speed up your journey to a profitable, scalable startup.
How will you write your startup’s story?